ページの作成
親となるページを選択してください。

親ページに紐づくページを子ページといいます。
例: 親=スポーツ, 子1=サッカー, 子2=野球
子ページを親ページとして更に子ページを作成することも可能です。
例: 親=サッカー, 子=サッカーのルール
親ページはいつでも変更することが可能なのでとりあえず作ってみましょう!
| この記事の要点 |
|
Matplotlib における色指定の基本
Matplotlib のグラフの色は、ほとんどのプロット関数で color 引数(または短縮形 c)で指定します。値の与え方は複数あります。
構文
import matplotlib.pyplot as plt
plt.plot(x, y, color="色の指定")
色の指定方法 5 つ
| 方法 | 例 | 説明 |
|---|---|---|
| 色名(フル) | color="red" | CSS と同じ約 140 種の名前 |
| 単文字エイリアス | color="r" | r/g/b/c/m/y/k/w の 8 色 |
| 16 進カラー | color="#ff5733" | HTML/CSS と同じ書式 |
| RGB タプル | color=(1.0, 0.5, 0.0) | 各成分 0.0〜1.0 の float |
| RGBA タプル | color=(1.0, 0, 0, 0.5) | 4 番目が透明度 |
基本例
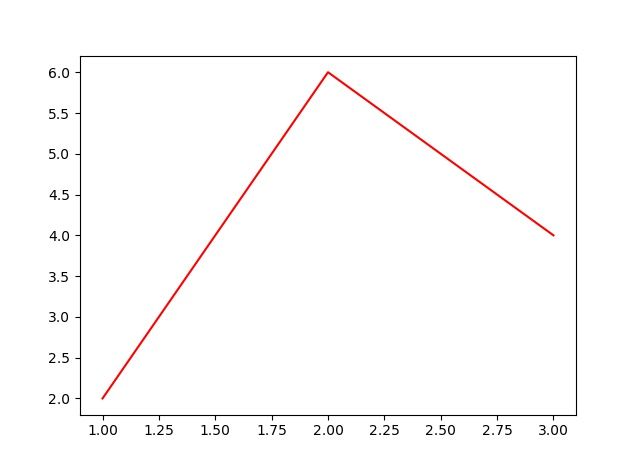
import matplotlib.pyplot as plt

x = [1, 2, 3]
y = [2, 6, 4]

plt.plot(x, y, color="red")
plt.show()
結果出力:
単文字エイリアス(8 色)
| 文字 | 色 |
|---|---|
| b | blue(青) |
| g | green(緑) |
| r | red(赤) |
| c | cyan(シアン) |
| m | magenta(マゼンタ) |
| y | yellow(黄) |
| k | black(黒) |
| w | white(白) |
plt.plot(x, y1, "r-")    # 赤の実線
plt.plot(x, y2, "g--")   # 緑の破線
plt.plot(x, y3, "b:") # 青の点線このように色+線種をまとめた fmt 文字列として 3 番目の引数に渡せるのも便利。
16 進カラーで微妙な色を出す
plt.plot(x, y, color="#3498db")     # 落ち着いた青
plt.plot(x, y, color="#e74c3c")     # 鮮やかな赤
plt.plot(x, y, color="#2ecc71")     # エメラルドグリーン
透明度 alpha
重ね合わせやヒートマップなど、濃淡で表現したい時は alpha を指定します(0.0 = 完全透明、1.0 = 不透明)。
plt.fill_between(x, y, color="blue", alpha=0.3)   # 薄く塗りつぶし
plt.scatter(x, y, color="red", alpha=0.5)
カラーサイクル
複数の線を引いた場合、明示的に color を指定しなければ カラーサイクルに従って自動で別の色が割り当てられます。デフォルトの"tab10" パレットは色覚特性に配慮されており、視認性が高いのが特徴。
plt.plot(x, y1, label="A")     # tab:blue
plt.plot(x, y2, label="B")     # tab:orange
plt.plot(x, y3, label="C")     # tab:green
plt.legend()
plt.show()
カラーマップ(連続色)
scatter / imshow / contour 等では、値に応じてグラデーションで色を変えられます。
import numpy as np
import matplotlib.pyplot as plt

x = np.random.rand(100)
y = np.random.rand(100)
z = np.random.rand(100)

plt.scatter(x, y, c=z, cmap="viridis")
plt.colorbar()
plt.show()| cmap 名 | 特徴 |
|---|---|
| viridis | 知覚的に均一。デフォルト推奨 |
| plasma | 暗→明 へのグラデーション |
| coolwarm | 発散型。0 を中心に正負を表現 |
| gray | 白黒印刷向け |
| jet | 古典的レインボー(現在は非推奨) |
線・マーカー・塗りで色を分ける
plt.plot(
    x, y,
    color="navy",            # 線の色
    marker="o",
    markerfacecolor="yellow",# マーカー塗り
    markeredgecolor="red",   # マーカー枠
)
背景色 / グリッド色
ax = plt.gca()
ax.set_facecolor("#f5f5f5")              # 背景色
ax.grid(color="white", linewidth=1.2)    # グリッド線色
色を保存して再利用する
大量のグラフで一貫した色を使うには、色を変数や辞書にまとめて管理するのが運用しやすいです。会社のブランドカラーや、グラフごとの意味付け(“売上は青、原価は赤” など)を定数化しておけば、後から一括変更も容易になります。
# 色定義をまとめる
COLORS = {
    "sales":   "#3498db",
    "cost":    "#e74c3c",
    "profit":  "#2ecc71",
    "tax":     "#95a5a6",
}

plt.plot(x, sales,  color=COLORS["sales"],  label="売上")
plt.plot(x, cost,   color=COLORS["cost"],   label="原価")
plt.plot(x, profit, color=COLORS["profit"], label="利益")
plt.legend()
色覚バリアフリーへの配慮
2 色の対比で赤と緑はもっとも識別しづらい組み合わせ(色覚特性のあるユーザに不親切)。重要な区別には線種(実線 / 破線)やマーカー形状も合わせて変えるのが望ましいです。デフォルト tab10 や viridis はこの観点で設計されています。
FAQ
Q: color と c はどう違う?
A: 同じ意味です。scatter など一部関数では c が値ベクタを受け付け cmap で色マッピングできるため、書き分けることが多いです。
Q: NumPy 配列の色は?
A: 値の配列を c に渡し、cmap="viridis" 等を指定すれば値→色のマッピングが自動。
Q: HTML 16 進と RGB タプルどちらが良い?
A: チームで色のトーンを管理するなら 16 進で定数化するのが運用しやすいです。
関連
- Matplotlib — Python の標準グラフライブラリ
- plot — 折れ線グラフ
- scatter — 散布図
- imshow — 画像 / ヒートマップ
- colormap — 連続色のパレット
- seaborn — Matplotlib ベースの統計グラフ
ページの作成
親となるページを選択してください。
親ページに紐づくページを子ページといいます。
例: 親=スポーツ, 子1=サッカー, 子2=野球
子ページを親ページとして更に子ページを作成することも可能です。
例: 親=サッカー, 子=サッカーのルール
親ページはいつでも変更することが可能なのでとりあえず作ってみましょう!
子ページはありません
人気ページ
- 1 Eclipseで「サーバーに追加または除去できるリソースがありません。」の原因と対処法
- 2 tomcat の起動 / 停止ログと catalina.log・catalina.out の違い
- 3 JavaScript base URL 取得方法|window.location.origin と SSR/Node.js 対応
- 4 YouTube Data API v3 エラー一覧|403/400/404 の主要原因と切り分け
- 5 Spring Frameworkのアノテーション一覧
- 6 Laravel エラー一覧|500/Blade/DB 接続/ルーティングの代表エラー
- 7 3Dグラフィックスとは|モデリング/レンダリング/主要ソフトウェア (Blender / Maya)
- 8 【Spring】@Valueアノテーションとは
- 9 CATALINA_HOME の確認方法 (Linux / Mac)
- 10 【Spring】@Autowiredアノテーションとは
最近更新/作成されたページ
- IPv6とは|128bitアドレス・コロン16進表記/::省略・リンクローカル・SLAAC・デュアルスタック 2026-06-22 12:34:44
- MAC アドレスフィルタリングの仕組みと限界 | ネットワーク入門 2026-06-22 12:19:10
- VPNとは|暗号トンネル・サイト間/リモートアクセス・IPsec/SSL-VPN/WireGuardを解説 2026-06-22 12:19:10
- HTTP/2 とは 多重化・HPACK・バイナリフレーム | ネットワーク入門 2026-06-22 12:17:25
- gRPC とは HTTP/2 + Protocol Buffers の高速 RPC | ネットワーク入門 2026-06-22 12:17:25
- WebSocket とは 全二重リアルタイム通信 ws/wss | ネットワーク入門 2026-06-22 12:17:25
- WebRTC とは ブラウザ間 P2P の音声・映像・データ通信 | ネットワーク入門 2026-06-22 12:17:25
- HTTP/3 (QUIC) とは UDP ベースの低遅延 Web 通信 | ネットワーク入門 2026-06-22 12:17:25
- Web通信プロトコル入門 HTTP/2・HTTP/3・WebSocket・gRPC・WebRTC | ネットワーク入門 2026-06-22 12:17:25
- HAProxy とは frontend/backend と設定例 | ネットワーク入門 2026-06-22 12:17:24
- iptables/nftablesとは|テーブル・チェーン・ルール例・永続化をLinux視点で解説 2026-06-22 12:17:24
- CDN とは エッジキャッシュ・TTL・Cloudflare/CloudFront | ネットワーク入門 2026-06-22 12:17:24
- TLS/SSLの仕組み|ハンドシェイク・暗号スイート・前方秘匿性・証明書検証をわかりやすく解説 2026-06-22 12:17:24
- ファイアウォールとは|パケットフィルタ・ステートフル・DMZ・次世代FW(L4/L7)を解説 2026-06-22 12:17:24
- 証明書と認証局(CA)とは|X.509・信頼チェーン・DV/OV/EV・失効(CRL/OCSP)を解説 2026-06-22 12:17:24
コメントを削除してもよろしいでしょうか?