ページの作成
親となるページを選択してください。

親ページに紐づくページを子ページといいます。
例: 親=スポーツ, 子1=サッカー, 子2=野球
子ページを親ページとして更に子ページを作成することも可能です。
例: 親=サッカー, 子=サッカーのルール
親ページはいつでも変更することが可能なのでとりあえず作ってみましょう!
| この記事の要点 |
|
タイトル・軸ラベルの基本
グラフの「何を描いているか」「軸の単位は何か」を伝える要素。これが無いグラフはレポートとして致命的です。
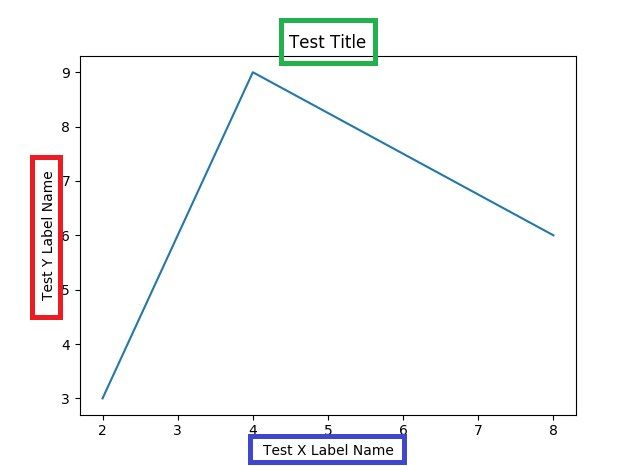
最小コード
import matplotlib.pyplot as plt

x = [1, 2, 3, 4, 5]
y = [2, 4, 1, 5, 3]

plt.plot(x, y, marker='o')

plt.title('Sample Title')
plt.xlabel('X axis label')
plt.ylabel('Y axis label')

plt.show()
主なオプション
| 引数 | 意味 | 例 |
|---|---|---|
fontsize | 文字サイズ (ポイント or 名前) | 18 / 'x-large' |
fontweight | 太さ | 'normal' / 'bold' / 'light' |
fontstyle | スタイル | 'normal' / 'italic' / 'oblique' |
color | 文字色 | 'red' / '#336699' |
fontname | フォント名 | 'Arial' / 'Hiragino Sans' |
loc | タイトル位置 (title 専用) | 'left' / 'center' / 'right' |
pad | 軸との余白 (ポイント) | pad=15 |
labelpad | 軸ラベルと軸の距離 | labelpad=10 |
スタイル指定例
import matplotlib.pyplot as plt

x = [1, 2, 3, 4, 5]
y = [2, 4, 1, 5, 3]

plt.plot(x, y, marker='o')

plt.title('Sales Trend',
          fontsize=20, fontweight='bold', color='navy',
          loc='left', pad=15)

plt.xlabel('Month', fontsize=14, color='gray', labelpad=10)
plt.ylabel('Sales (M yen)', fontsize=14, color='gray', labelpad=10)

plt.tight_layout()
plt.show()
OO スタイル (Axes API)
複数 subplot を扱う場面では Axes オブジェクト経由が推奨です。
import matplotlib.pyplot as plt
import numpy as np

fig, axes = plt.subplots(1, 2, figsize=(10, 4))

x = np.linspace(0, 10, 100)
axes[0].plot(x, np.sin(x))
axes[0].set_title('sin(x)')
axes[0].set_xlabel('x')
axes[0].set_ylabel('sin(x)')

axes[1].plot(x, np.cos(x), color='orange')
axes[1].set_title('cos(x)')
axes[1].set_xlabel('x')
axes[1].set_ylabel('cos(x)')

# Figure 全体のタイトル
fig.suptitle('Trigonometric Functions', fontsize=16, fontweight='bold')

plt.tight_layout()
plt.show()
TeX 数式の埋め込み
Matplotlib は軽量な数式パーサ (mathtext) を持ち、ドル記号で囲むだけで数式を描けます。文字列は raw 文字列にして \\ エスケープを避けるのが定石。
import matplotlib.pyplot as plt
import numpy as np

x = np.linspace(0, 2 * np.pi, 100)
plt.plot(x, np.sin(x))

plt.title(r'$y = \sin(x)$ for $x \in [0, 2\pi]$', fontsize=16)
plt.xlabel(r'$x$ (rad)', fontsize=14)
plt.ylabel(r'$\sin(x)$', fontsize=14)

# よく使う数式
# r'$\alpha$ $\beta$ $\gamma$ $\Delta$ $\pi$'
# r'$\frac{a}{b}$ $\sqrt{x}$ $x^2$ $x_{i+1}$'
# r'$\sum_{i=0}^{N} x_i$ $\int_0^\infty e^{-x} dx$'

plt.show()
本物の LaTeX エンジンを使いたければ:
import matplotlib as mpl
mpl.rcParams['text.usetex'] = True
mpl.rcParams['font.family'] = 'serif'
# 要: 環境に LaTeX (texlive 等) インストール済
日本語化
Matplotlib のデフォルトフォントは日本語を持たず、軸ラベルに「平均」など書くと □□□ (豆腐文字) になります。対処は 3 通り。
方法 A: japanize-matplotlib (一番楽)
pip install japanize-matplotlibimport matplotlib.pyplot as plt
import japanize_matplotlib # noqa: F401 import するだけで日本語化
plt.plot([1, 2, 3], [1, 4, 9])
plt.title('日本語タイトル')
plt.xlabel('横軸')
plt.ylabel('縦軸')
plt.show()方法 B: rcParams でフォント指定
import matplotlib.pyplot as plt
import matplotlib as mpl

# OS に応じて利用可能なフォントを指定
# Windows: 'Yu Gothic' / 'Meiryo' / 'MS Gothic'
# macOS  : 'Hiragino Sans' / 'Hiragino Maru Gothic Pro'
# Linux  : 'Noto Sans CJK JP' / 'IPAexGothic'
mpl.rcParams['font.family'] = 'Hiragino Sans'

plt.title('日本語タイトル')
plt.show()
方法 C: 個別に fontname 指定
plt.title('日本語タイトル', fontname='Yu Gothic')
plt.xlabel('横軸', fontname='Yu Gothic')
plt.ylabel('縦軸', fontname='Yu Gothic')
マイナス記号の文字化け対策
方法 B で日本語フォントを指定すると、軸の -1.0 等のマイナス記号が 豆腐になることがあります。axes.unicode_minus を False に。
import matplotlib as mpl
mpl.rcParams['font.family'] = 'Yu Gothic'
mpl.rcParams['axes.unicode_minus'] = False   # ハイフン (-) を使う
軸目盛とラベルの違い
| 要素 | 関数 | 例 |
|---|---|---|
| タイトル | title | 「2024 年売上推移」 |
| 軸ラベル | xlabel / ylabel | 「月」「売上 (万円)」 |
| 目盛り値 | xticks / yticks | 1, 2, 3, ... の位置と表示 |
| 目盛りラベル | set_xticklabels | 「1月」「2月」 (位置 1, 2 に対応) |
| 凡例 | legend | 系列ごとの説明 |
位置と整列
import matplotlib.pyplot as plt

x = [1, 2, 3]
y = [1, 4, 9]

# タイトルを左寄せ + 上に余白
plt.plot(x, y)
plt.title('Left title', loc='left', pad=20)

# x 軸ラベルを軸下に近く
plt.xlabel('X', labelpad=2)

# y 軸ラベルを回転
plt.ylabel('Y value', rotation=0, labelpad=30, ha='right')

plt.show()
全体に共通スタイルを当てる (rcParams)
import matplotlib as mpl

mpl.rcParams.update({
    'axes.titlesize': 16,
    'axes.titleweight': 'bold',
    'axes.labelsize': 13,
    'axes.labelweight': 'normal',
    'axes.labelcolor': '#333333',
    'axes.titlepad': 15,
    'axes.labelpad': 8,
})

# 以降の plt.title / plt.xlabel に自動適用
FAQ
Q: タイトルがグラフに重なって読めない
A: plt.tight_layout() または plt.subplots_adjust(top=0.85) で上部余白を増やします。fig.suptitle 使用時は tight_layout(rect=[0,0,1,0.95])。
Q: 数式の \\alpha がそのまま文字列として表示される
A: raw 文字列 (r'') + ドル記号で囲む必要があります: r'$\\alpha$'。
Q: subplot ごとに別フォントを使いたい
A: ax.set_title('A', fontname='Arial') のように Axes 単位で指定。rcParams を変えても以降だけに効きます。
Q: 軸ラベルを 2 段にしたい
A: 改行文字 \\n を入れれば 2 行表示: plt.xlabel('時刻\\n(2024 年 1 月)')。
Q: タイトルに変数を埋め込みたい
A: f 文字列で plt.title(f'Mean = {mean:.2f}')。数式と組み合わせる場合は f'$\\\\mu = {mean:.2f}$' でエスケープに注意。
ページの作成
親となるページを選択してください。
親ページに紐づくページを子ページといいます。
例: 親=スポーツ, 子1=サッカー, 子2=野球
子ページを親ページとして更に子ページを作成することも可能です。
例: 親=サッカー, 子=サッカーのルール
親ページはいつでも変更することが可能なのでとりあえず作ってみましょう!
子ページはありません
人気ページ
- 1 Eclipseで「サーバーに追加または除去できるリソースがありません。」の原因と対処法
- 2 tomcat の起動 / 停止ログと catalina.log・catalina.out の違い
- 3 JavaScript base URL 取得方法|window.location.origin と SSR/Node.js 対応
- 4 YouTube Data API v3 エラー一覧|403/400/404 の主要原因と切り分け
- 5 Spring Frameworkのアノテーション一覧
- 6 Laravel エラー一覧|500/Blade/DB 接続/ルーティングの代表エラー
- 7 3Dグラフィックスとは|モデリング/レンダリング/主要ソフトウェア (Blender / Maya)
- 8 【Spring】@Valueアノテーションとは
- 9 CATALINA_HOME の確認方法 (Linux / Mac)
- 10 【Spring】@Autowiredアノテーションとは
最近更新/作成されたページ
- IPv6とは|128bitアドレス・コロン16進表記/::省略・リンクローカル・SLAAC・デュアルスタック 2026-06-22 12:34:44
- MAC アドレスフィルタリングの仕組みと限界 | ネットワーク入門 2026-06-22 12:19:10
- VPNとは|暗号トンネル・サイト間/リモートアクセス・IPsec/SSL-VPN/WireGuardを解説 2026-06-22 12:19:10
- HTTP/2 とは 多重化・HPACK・バイナリフレーム | ネットワーク入門 2026-06-22 12:17:25
- gRPC とは HTTP/2 + Protocol Buffers の高速 RPC | ネットワーク入門 2026-06-22 12:17:25
- WebSocket とは 全二重リアルタイム通信 ws/wss | ネットワーク入門 2026-06-22 12:17:25
- WebRTC とは ブラウザ間 P2P の音声・映像・データ通信 | ネットワーク入門 2026-06-22 12:17:25
- HTTP/3 (QUIC) とは UDP ベースの低遅延 Web 通信 | ネットワーク入門 2026-06-22 12:17:25
- Web通信プロトコル入門 HTTP/2・HTTP/3・WebSocket・gRPC・WebRTC | ネットワーク入門 2026-06-22 12:17:25
- HAProxy とは frontend/backend と設定例 | ネットワーク入門 2026-06-22 12:17:24
- iptables/nftablesとは|テーブル・チェーン・ルール例・永続化をLinux視点で解説 2026-06-22 12:17:24
- CDN とは エッジキャッシュ・TTL・Cloudflare/CloudFront | ネットワーク入門 2026-06-22 12:17:24
- TLS/SSLの仕組み|ハンドシェイク・暗号スイート・前方秘匿性・証明書検証をわかりやすく解説 2026-06-22 12:17:24
- ファイアウォールとは|パケットフィルタ・ステートフル・DMZ・次世代FW(L4/L7)を解説 2026-06-22 12:17:24
- 証明書と認証局(CA)とは|X.509・信頼チェーン・DV/OV/EV・失効(CRL/OCSP)を解説 2026-06-22 12:17:24
コメントを削除してもよろしいでしょうか?