タイトル: 色
SEOタイトル: Matplotlib で色を指定する方法
これはMatplotlibのグラフの色の設定に関する記事です。
| 構文 |
|---|
|
plot(x, y, color="色の種類") |
| 例 |
|---|
|
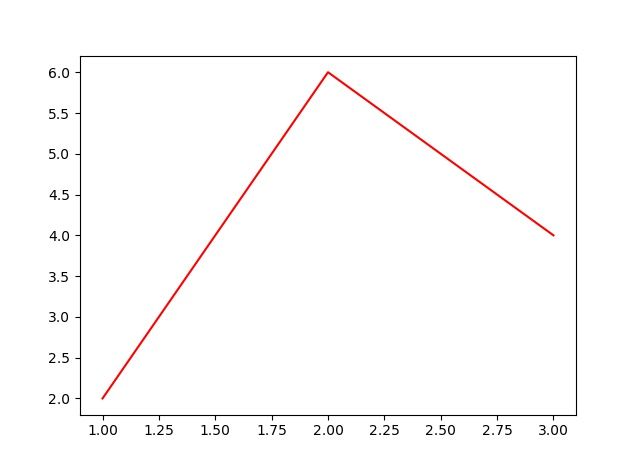
import matplotlib.pyplot as plt x = [1, 2, 3] plt.plot(x, y, color="red") plt.show() |
| 結果出力 |
|---|
|
|