ページの作成
親となるページを選択してください。

親ページに紐づくページを子ページといいます。
例: 親=スポーツ, 子1=サッカー, 子2=野球
子ページを親ページとして更に子ページを作成することも可能です。
例: 親=サッカー, 子=サッカーのルール
親ページはいつでも変更することが可能なのでとりあえず作ってみましょう!
| この記事の要点 |
|
標準の線種 4 種
| linestyle 値 | 記号 | 見た目 | 用途 |
|---|---|---|---|
'solid' | '-' | 実線 ─ | メイン系列 |
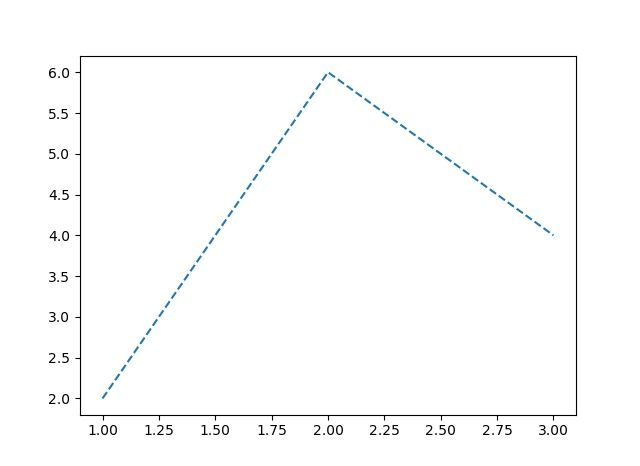
'dashed' | '--' | 破線 ─ ─ ─ | サブ系列・予測値 |
'dotted' | ':' | 点線 · · · · · | 補助線・閾値 |
'dashdot' | '-.' | 一点鎖線 ─·─·─ | 区切り線 |
'None' / '' | — | 線なし | マーカーだけ表示 |
基本的な使い方
import matplotlib.pyplot as plt
import numpy as np

x = np.linspace(0, 10, 100)

# linestyle 引数で指定
plt.plot(x, np.sin(x),       linestyle='-',  label='solid')
plt.plot(x, np.sin(x) + 0.5, linestyle='--', label='dashed')
plt.plot(x, np.sin(x) + 1.0, linestyle=':',  label='dotted')
plt.plot(x, np.sin(x) + 1.5, linestyle='-.', label='dashdot')

plt.legend()
plt.show()

# 短縮形 (ls)
plt.plot(x, np.sin(x), ls='--')
フォーマット文字列で一括指定
plot() の 3 番目の引数として、色 + マーカー + 線種を文字列で渡せます (MATLAB 由来の記法):
# 'r--' = 赤の破線
plt.plot(x, y, 'r--')

# 'go-' = 緑の丸マーカー + 実線
plt.plot(x, y, 'go-')

# 'k:' = 黒の点線
plt.plot(x, y, 'k:')

# 'bs-.' = 青の四角マーカー + 一点鎖線
plt.plot(x, y, 'bs-.')

# 'm^' = マゼンタの三角マーカー (線なし)
plt.plot(x, y, 'm^')| 色 | 記号 | マーカー | 記号 |
|---|---|---|---|
| blue 青 | b | point . | . |
| green 緑 | g | circle ● | o |
| red 赤 | r | triangle ▲ | ^ |
| cyan シアン | c | square ■ | s |
| magenta マゼンタ | m | plus + | + |
| yellow 黄 | y | cross × | x |
| black 黒 | k | diamond ◆ | D |
| white 白 | w | star ★ | * |
linewidth で太さを変える
plt.plot(x, np.sin(x), linestyle='-',  linewidth=0.5, label='細')
plt.plot(x, np.cos(x), linestyle='-',  linewidth=2,   label='中')
plt.plot(x, np.tan(x), linestyle='-',  linewidth=4,   label='太')

# 短縮形 (lw)
plt.plot(x, y, ls='--', lw=2.5)
カスタムダッシュパターン
タプルで (オフセット, (on, off, on, off, ...)) 形式で指定できます。on は線、off は空白の長さ:
# (オフセット, (実線長, 空白長, 実線長, 空白長, ...))

# 長破線
plt.plot(x, y, linestyle=(0, (5, 5)), label='loosely dashed')

# 緊密な点線
plt.plot(x, y, linestyle=(0, (1, 1)), label='densely dotted')

# 二点鎖線 (実線 3 - 空白 1 - 点 1 - 空白 1)
plt.plot(x, y, linestyle=(0, (3, 1, 1, 1)), label='custom')

# 三点鎖線
plt.plot(x, y, linestyle=(0, (3, 1, 1, 1, 1, 1)), label='dash-dot-dot')

# 名前付きスタイル (Matplotlib 3.x)
plt.plot(x, y, linestyle='loosely dashed')
plt.plot(x, y, linestyle='densely dotted')| 名前 | タプル |
|---|---|
| loosely dotted | (0, (1, 10)) |
| dotted | (0, (1, 1)) |
| densely dotted | (0, (1, 1)) |
| loosely dashed | (0, (5, 10)) |
| dashed | (0, (5, 5)) |
| densely dashed | (0, (5, 1)) |
| loosely dashdotted | (0, (3, 10, 1, 10)) |
| dashdotted | (0, (3, 5, 1, 5)) |
| densely dashdotted | (0, (3, 1, 1, 1)) |
| dashdotdotted | (0, (3, 5, 1, 5, 1, 5)) |
set_dashes() メソッド
Line2D オブジェクトに直接ダッシュパターンを設定する方法:
fig, ax = plt.subplots()
line, = ax.plot(x, y)

# 後からダッシュパターンを変更
line.set_dashes([5, 2, 1, 2])    # 実線 5 - 空白 2 - 点 1 - 空白 2
line.set_linestyle('--')
line.set_linewidth(2)

plt.show()
複数系列を区別する
系列数が多いときは、色だけでなく線種・マーカーも組み合わせるとわかりやすいです:
styles = ['-', '--', ':', '-.', (0, (3, 1, 1, 1))]
colors = ['C0', 'C1', 'C2', 'C3', 'C4']  # デフォルトカラーサイクル
markers = ['o', 's', '^', 'D', '*']

for i, (s, c, m) in enumerate(zip(styles, colors, markers)):
    plt.plot(x, np.sin(x + i),
             linestyle=s, color=c, marker=m,
             markevery=10,        # 10 点ごとにマーカー
             label=f'series {i+1}')

plt.legend()
plt.show()
グレースケール印刷向けの工夫
論文・印刷物では色が出ないことが多いため、線種で区別する習慣を付けると安全です:
# グレースケール + 線種で区別
plt.plot(x, y1, color='black', linestyle='-',  label='実測')
plt.plot(x, y2, color='black', linestyle='--', label='理論値')
plt.plot(x, y3, color='black', linestyle=':',  label='予測')
plt.plot(x, y4, color='gray',  linestyle='-.', label='対照')

# またはカラーマップで濃淡
import matplotlib.cm as cm
for i, y in enumerate(ys):
    plt.plot(x, y, color=cm.gray(i / len(ys)))
Seaborn の linestyle
Seaborn は色とスタイルを変数の値に応じて自動割当する style 引数を持ちます:
import seaborn as sns
import pandas as pd

df = pd.DataFrame({
    'time': [...],
    'value': [...],
    'group': ['A', 'B', 'A', 'B', ...],
})

# group 列の値ごとに自動で線種を割り当て
sns.lineplot(data=df, x='time', y='value',
             hue='group',     # 色も group で
             style='group',   # 線種も group で
             markers=True,    # マーカーも表示
             dashes=True)
軸線・補助線のスタイル
fig, ax = plt.subplots()

# 水平線・垂直線 (axhline / axvline)
ax.axhline(y=0, color='gray', linestyle='-',  linewidth=0.5)
ax.axvline(x=0, color='red',  linestyle='--', linewidth=1)

# グリッド
ax.grid(True, which='major', linestyle='-',  alpha=0.7)
ax.grid(True, which='minor', linestyle=':',  alpha=0.4)

# 閾値表示
ax.axhline(y=100, color='red', linestyle='--', label='上限')
ax.axhline(y=20,  color='blue', linestyle='--', label='下限')

# 矩形領域のハッチング (塗りつぶしの線パターン)
ax.fill_between(x, y, alpha=0.3, hatch='//', edgecolor='black')
FAQ
Q: 線種ではなく点だけプロットしたい
A: linestyle='None' を指定し、marker='o' 等を付けます。または plt.scatter() を使う。
Q: ダッシュパターンが思い通りにならない
A: (オフセット, (on, off, ...)) の値はポイント単位で、linewidth に応じて見え方が変わります。lw を変えたらパターンも調整してください。
Q: 線の端の形を変えたい
A: solid_capstyle / dash_capstyle で 'butt' / 'round' / 'projecting' を指定できます。
ページの作成
親となるページを選択してください。
親ページに紐づくページを子ページといいます。
例: 親=スポーツ, 子1=サッカー, 子2=野球
子ページを親ページとして更に子ページを作成することも可能です。
例: 親=サッカー, 子=サッカーのルール
親ページはいつでも変更することが可能なのでとりあえず作ってみましょう!
子ページ
子ページはありません
人気ページ
- 1 Eclipseで「サーバーに追加または除去できるリソースがありません。」の原因と対処法
- 2 tomcat の起動 / 停止ログと catalina.log・catalina.out の違い
- 3 JavaScript base URL 取得方法|window.location.origin と SSR/Node.js 対応
- 4 YouTube Data API v3 エラー一覧|403/400/404 の主要原因と切り分け
- 5 Spring Frameworkのアノテーション一覧
- 6 Laravel エラー一覧|500/Blade/DB 接続/ルーティングの代表エラー
- 7 3Dグラフィックスとは|モデリング/レンダリング/主要ソフトウェア (Blender / Maya)
- 8 【Spring】@Valueアノテーションとは
- 9 CATALINA_HOME の確認方法 (Linux / Mac)
- 10 【Spring】@Autowiredアノテーションとは
最近更新/作成されたページ
- IPv6とは|128bitアドレス・コロン16進表記/::省略・リンクローカル・SLAAC・デュアルスタック 2026-06-22 12:34:44
- MAC アドレスフィルタリングの仕組みと限界 | ネットワーク入門 2026-06-22 12:19:10
- VPNとは|暗号トンネル・サイト間/リモートアクセス・IPsec/SSL-VPN/WireGuardを解説 2026-06-22 12:19:10
- HTTP/2 とは 多重化・HPACK・バイナリフレーム | ネットワーク入門 2026-06-22 12:17:25
- gRPC とは HTTP/2 + Protocol Buffers の高速 RPC | ネットワーク入門 2026-06-22 12:17:25
- WebRTC とは ブラウザ間 P2P の音声・映像・データ通信 | ネットワーク入門 2026-06-22 12:17:25
- Web通信プロトコル入門 HTTP/2・HTTP/3・WebSocket・gRPC・WebRTC | ネットワーク入門 2026-06-22 12:17:25
- HTTP/3 (QUIC) とは UDP ベースの低遅延 Web 通信 | ネットワーク入門 2026-06-22 12:17:25
- WebSocket とは 全二重リアルタイム通信 ws/wss | ネットワーク入門 2026-06-22 12:17:25
- CDN とは エッジキャッシュ・TTL・Cloudflare/CloudFront | ネットワーク入門 2026-06-22 12:17:24
- HAProxy とは frontend/backend と設定例 | ネットワーク入門 2026-06-22 12:17:24
- iptables/nftablesとは|テーブル・チェーン・ルール例・永続化をLinux視点で解説 2026-06-22 12:17:24
- TLS/SSLの仕組み|ハンドシェイク・暗号スイート・前方秘匿性・証明書検証をわかりやすく解説 2026-06-22 12:17:24
- ファイアウォールとは|パケットフィルタ・ステートフル・DMZ・次世代FW(L4/L7)を解説 2026-06-22 12:17:24
- 証明書と認証局(CA)とは|X.509・信頼チェーン・DV/OV/EV・失効(CRL/OCSP)を解説 2026-06-22 12:17:24
コメントを削除してもよろしいでしょうか?