タイトル: 縦棒グラフ
これはMatplotlibの縦棒グラフに関する記事です。
縦棒グラフと横棒グラフの説明をします。
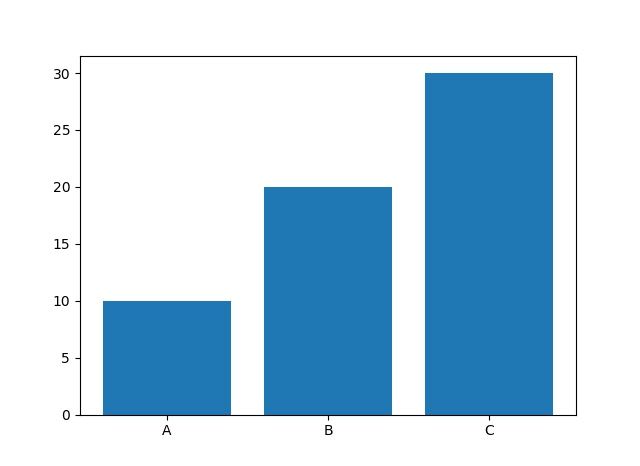
■縦棒グラフ
| 構文 |
|---|
|
bar(left, height) |
| 例 |
|---|
|
import matplotlib.pyplot as plt left = range(0, 3) plt.bar(left, height, tick_label=label) plt.show() |
tick_labelを指定することで棒グラフにラベルを貼ることができます。
| 出力結果 |
|---|
|
|
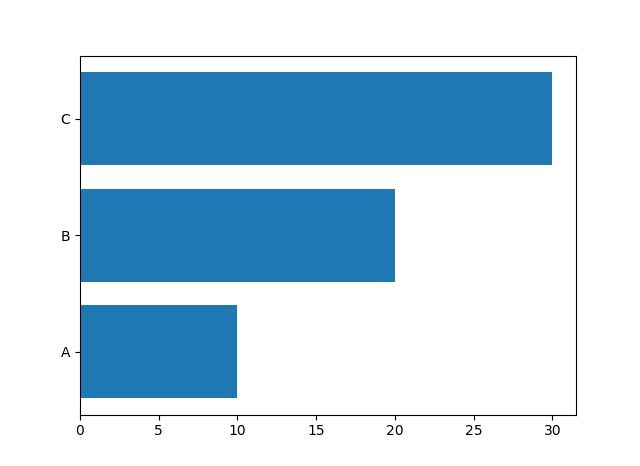
■横棒グラフ
| 構文 |
|---|
|
barh(bottom, width) |
| 例 |
|---|
|
import matplotlib.pyplot as plt bottom = range(0, 3) plt.barh(bottom, width, tick_label=label) plt.show() |
tick_labelを指定することで棒グラフにラベルを貼ることができます。
| 出力結果 |
|---|
|
|