タイトル: 線のラベル
これはMatplotlibのグラフの線のラベルに関する記事です。
| 構文 |
|---|
|
plot(x, y, label="ラベル名") legend(loc="表示位置") |
locに指定できる値は以下の通りです。
'best' or 0,
'upperright' or 1,
'upperleft' or 2,
'lowerleft' or 3,
'lowerright' or 4,
'right' or 5,
'centerleft' or 6,
'centerright' or 7,
'lowercenter' or 8,
'uppercenter' or 9,
'center' or 10,
| 例 |
|---|
|
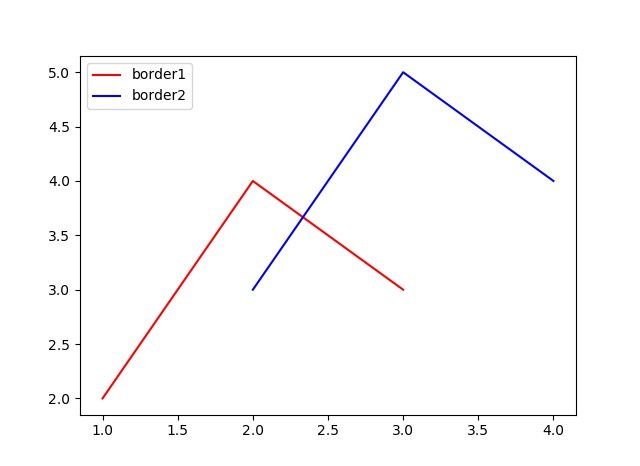
import matplotlib.pyplot as plt x1 = [1, 2, 3] x2 = [2, 3, 4] plt.legend(loc="upper left") |
| 出力結果 |
|---|
|
|
左上に線毎のラベルが表示されています。


