タイトル: 折れ線グラフ
これはMatplotlibの折れ線グラフに関する記事です。
| 構文 |
|---|
|
x = [値1, 値2, ・・・] y = [値1, 値2, ・・・] plot(x, y) plot.show() |
| 例 |
|---|
|
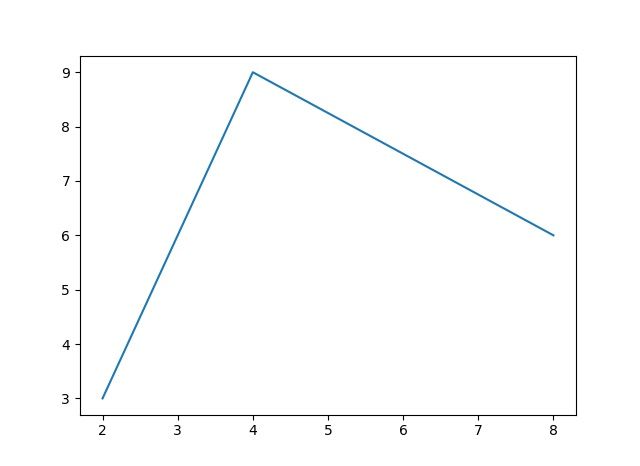
import matplotlib.pyplot as plt x = [2, 4, 8] plt.plot(x, y) |
| 出力結果 |
|---|
|
|

IT総合Wiki
これはMatplotlibの折れ線グラフに関する記事です。
| 構文 |
|---|
|
x = [値1, 値2, ・・・] y = [値1, 値2, ・・・] plot(x, y) plot.show() |
| 例 |
|---|
|
import matplotlib.pyplot as plt x = [2, 4, 8] plt.plot(x, y) |
| 出力結果 |
|---|
|
|