タイトル: 線のラベル
SEOタイトル: Matplotlib 線グラフのラベル完全ガイド(legend / annotate / 日本語)
| この記事の要点 |
|
線にラベルを付ける
import matplotlib.pyplot as plt
import numpy as np

x = np.linspace(0, 2*np.pi, 100)

plt.plot(x, np.sin(x), label='sin(x)')
plt.plot(x, np.cos(x), label='cos(x)')
plt.plot(x, np.sin(x) * np.cos(x), label='sin(x)*cos(x)')

plt.xlabel('x')
plt.ylabel('y')
plt.title('Trigonometric functions')

plt.legend()    # ★ これを呼ばないと凡例は出ない
plt.show()
legend の位置指定
| loc | 位置 |
|---|---|
'best' | 自動(デフォルト、データと被らない場所) |
'upper right' / 1 | 右上 |
'upper left' / 2 | 左上 |
'lower left' / 3 | 左下 |
'lower right' / 4 | 右下 |
'right' / 5 | 右中 |
'center left' / 6 | 左中 |
'center right' / 7 | 右中 |
'lower center' / 8 | 下中央 |
'upper center' / 9 | 上中央 |
'center' / 10 | 中央 |
凡例をグラフの外に出す
plt.plot(x, np.sin(x), label='sin(x)')
plt.plot(x, np.cos(x), label='cos(x)')

# 右外
plt.legend(loc='upper left', bbox_to_anchor=(1.02, 1.0), borderaxespad=0)

# 下外
plt.legend(loc='upper center', bbox_to_anchor=(0.5, -0.1),
           ncol=3, fancybox=True, shadow=True)

# レイアウト調整(外に出した凡例が切れないように)
plt.tight_layout()
# または
plt.subplots_adjust(right=0.8)
legend の見た目カスタマイズ
plt.legend(
    loc='upper right',
    fontsize=12,             # フォントサイズ
    title='系列',            # 凡例タイトル
    title_fontsize=14,
    frameon=True,            # 枠線
    fancybox=True,           # 角丸
    shadow=True,             # 影
    framealpha=0.8,          # 背景透過度
    edgecolor='black',       # 枠線色
    facecolor='lightyellow', # 背景色
    ncol=2,                  # 列数
    markerscale=1.5,         # マーカー拡大
    handlelength=3,          # 線サンプルの長さ
    columnspacing=1.5,       # 列間隔
    labelspacing=0.5,        # 行間隔
)
線スタイル・色・マーカー
# 線スタイル
plt.plot(x, y1, linestyle='-',  label='実線')
plt.plot(x, y2, linestyle='--', label='破線')
plt.plot(x, y3, linestyle='-.', label='一点鎖線')
plt.plot(x, y4, linestyle=':',  label='点線')

# 色 (英名 / HEX / RGB)
plt.plot(x, y, color='red')
plt.plot(x, y, color='#FF5733')
plt.plot(x, y, color=(0.1, 0.2, 0.5))

# マーカー
plt.plot(x, y, marker='o', markersize=8, markerfacecolor='yellow',
         markeredgecolor='black', label='Mark')

# 一括ショートカット fmt: '[color][marker][linestyle]'
plt.plot(x, y, 'ro--', label='赤丸破線')
plt.plot(x, y, 'g^-',  label='緑三角実線')
plt.plot(x, y, 'b.:',  label='青点点線')

# 主なマーカー: o . , ^ v < > s p * h + x D d| マーカー | 説明 |
|---|---|
o | 丸 |
. | 小さな点 |
^ v < > | 三角(上下左右) |
s | 正方形 |
p | 五角形 |
* | 星 |
h H | 六角形 |
+ x | プラス / バツ |
D d | ダイアモンド |
annotate で矢印付き注釈
x = np.linspace(0, 10, 100)
y = np.sin(x)

plt.plot(x, y, label='sin(x)')

# 最大値を矢印で示す
max_idx = np.argmax(y)
plt.annotate(
    f'最大値\n({x[max_idx]:.2f}, {y[max_idx]:.2f})',
    xy=(x[max_idx], y[max_idx]),         # 矢印の指す先
    xytext=(x[max_idx]+2, y[max_idx]+0.3), # テキスト位置
    fontsize=12,
    arrowprops=dict(
        arrowstyle='->',
        color='red',
        lw=2,
        connectionstyle='arc3,rad=0.2',
    ),
    bbox=dict(boxstyle='round,pad=0.5', facecolor='yellow', alpha=0.7),
)
plt.legend()
plt.show()
軸ラベル・タイトル・グリッド
plt.plot(x, y, label='系列1')

plt.xlabel('時間 [s]', fontsize=14)
plt.ylabel('振幅 [V]', fontsize=14)
plt.title('応答波形', fontsize=16, fontweight='bold')

# 軸範囲
plt.xlim(0, 10)
plt.ylim(-1.5, 1.5)

# 軸目盛
plt.xticks([0, 2, 4, 6, 8, 10])
plt.xticks(rotation=45)

# グリッド
plt.grid(True, linestyle='--', alpha=0.5)

# 軸のフォントサイズ
plt.tick_params(axis='both', labelsize=12)

# 凡例
plt.legend(fontsize=12, loc='upper right')
plt.tight_layout()
日本語フォント設定
デフォルトの Matplotlib は日本語表示で文字化け(豆腐 □)します。解決策:
# 推奨: matplotlib_fontja を入れるだけ
pip install matplotlib_fontja
import matplotlib.pyplot as plt
import matplotlib_fontja # ← この import だけで完了
plt.plot([1, 2, 3], [1, 4, 9], label='二乗')
plt.title('日本語タイトル')
plt.xlabel('横軸(時刻)')
plt.ylabel('縦軸(値)')
plt.legend()
plt.show()別の方法: japanize-matplotlib も人気。手動派は:
import matplotlib.pyplot as plt

# Windows
plt.rcParams['font.family'] = 'Meiryo'
# macOS
plt.rcParams['font.family'] = 'Hiragino Sans'
# Linux
plt.rcParams['font.family'] = 'IPAexGothic'
複数 subplots での凡例
fig, axes = plt.subplots(2, 2, figsize=(10, 8))

axes[0, 0].plot(x, np.sin(x), label='sin')
axes[0, 0].legend()
axes[0, 0].set_title('sin')

axes[0, 1].plot(x, np.cos(x), label='cos', color='r')
axes[0, 1].legend()

axes[1, 0].plot(x, x**2, label='x^2')
axes[1, 0].legend()

axes[1, 1].plot(x, np.exp(x/3), label='exp')
axes[1, 1].legend()

# 全体の凡例(手動収集)
handles = []
labels = []
for ax in axes.flat:
    h, l = ax.get_legend_handles_labels()
    handles += h
    labels += l
fig.legend(handles, labels, loc='lower center', ncol=4)

plt.tight_layout(rect=[0, 0.05, 1, 1])
FAQ
Q: legend を呼んでも何も出ない
A: 各 plot() に label=... を渡し忘れていないか確認。またはplt.legend(['A', 'B']) で順序指定もできます。
Q: 凡例の順序を変えたい
A: handles, labels = plt.gca().get_legend_handles_labels() で取得し、リオーダして plt.legend(handles[::-1], labels[::-1])。
Q: アンダースコア始まりラベルは凡例に出ない
A: label='_nolegend_' や _ 始まりは凡例除外仕様です。意図的に隠したい線に活用できます。
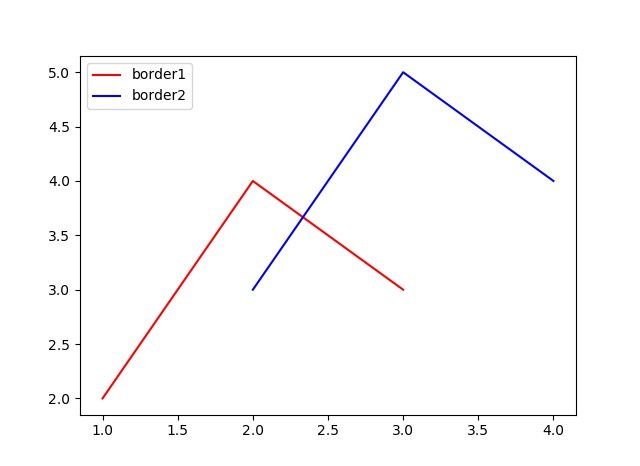
📸 参考画像
※ 旧バージョンから引き継いだ参考画像です。手順・図解の補助としてご覧ください。